Short and Sweet
‘The next decade will belong to gold.’
“Few people acknowledge that gold remains the superior asset of the 21st century,” writes London-based analyst Charlie Morris in a recently published Atlas Trust Gold Report, “nearly twice as profitable as the S&P 500. But it was a game of two halves with gold obliterating equities in the first and the S&P smashing gold in the second. Still, gold wins overall. I can’t help but think the next decade will belong to gold. After all, the S&P 500 trades at a lofty valuation by historical standards, while gold doesn’t. The main reason I have confidence that gold will win the 2020s is that this almighty asset bubble all around us will implode, and the crowded trades will disappoint the most. Gold is far from being crowded.”
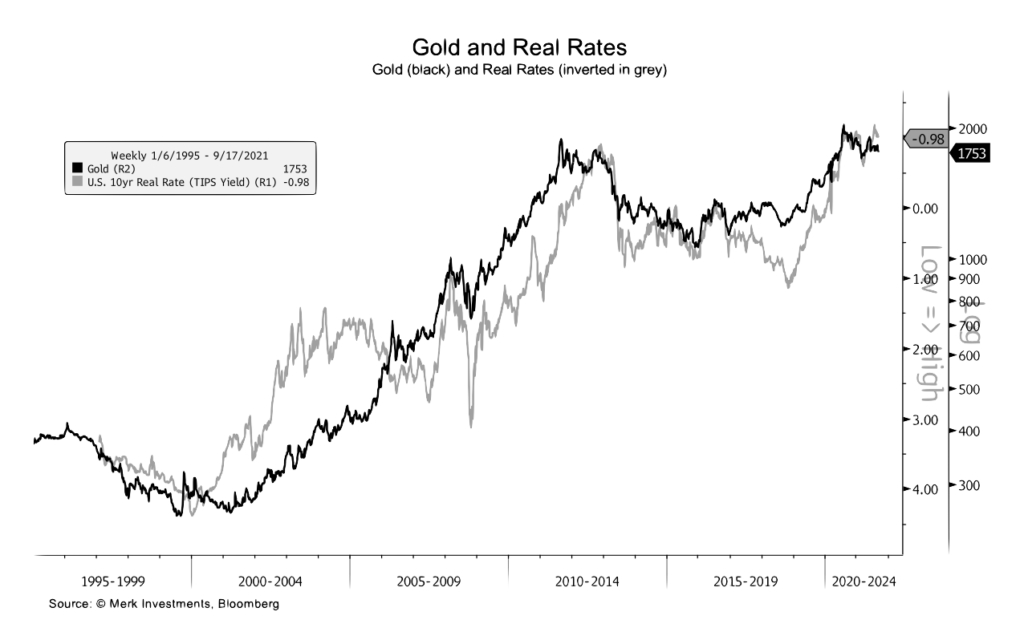
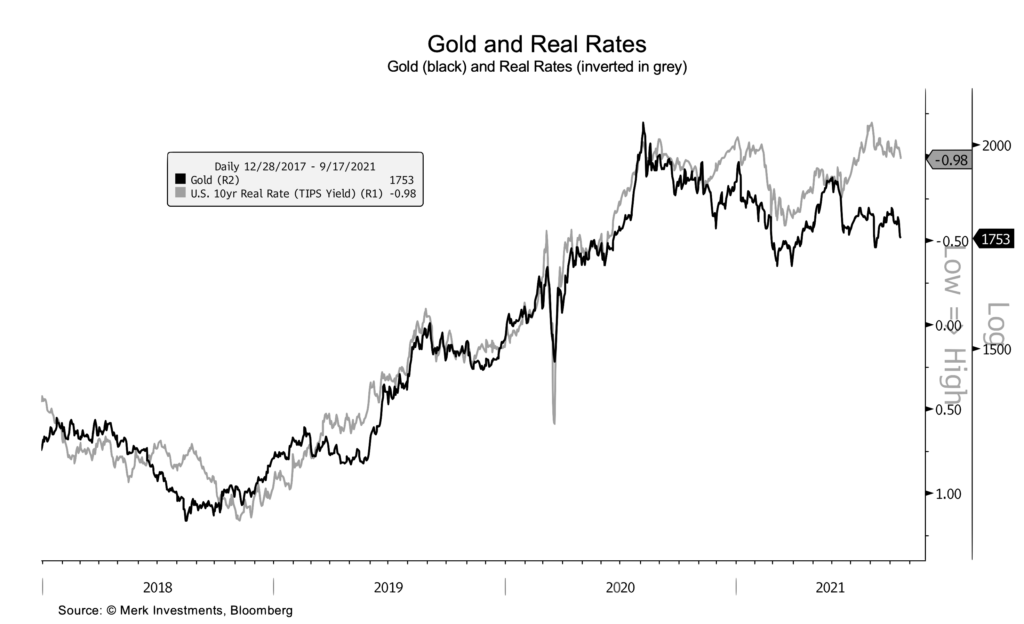
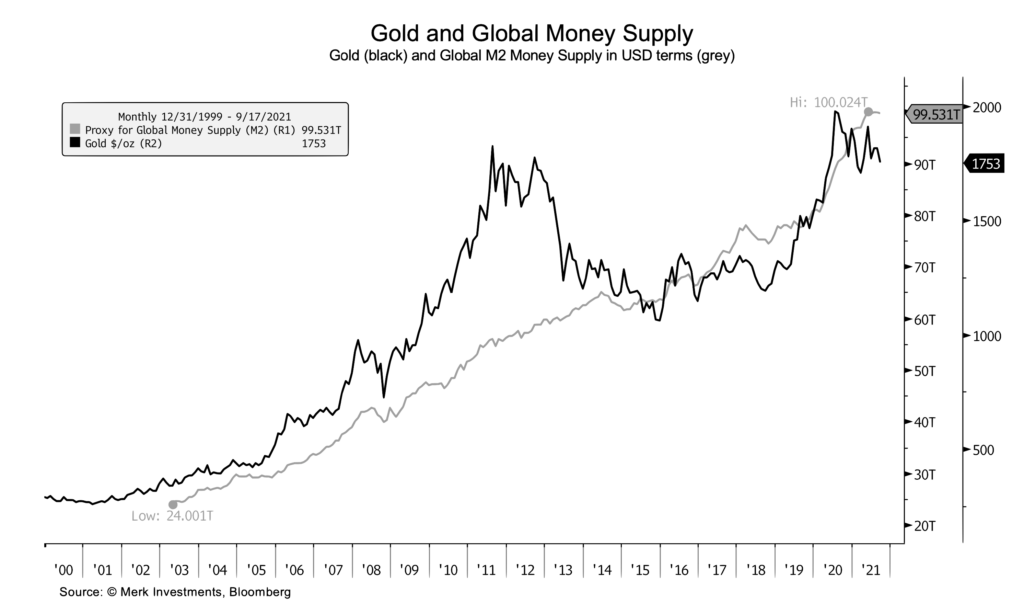
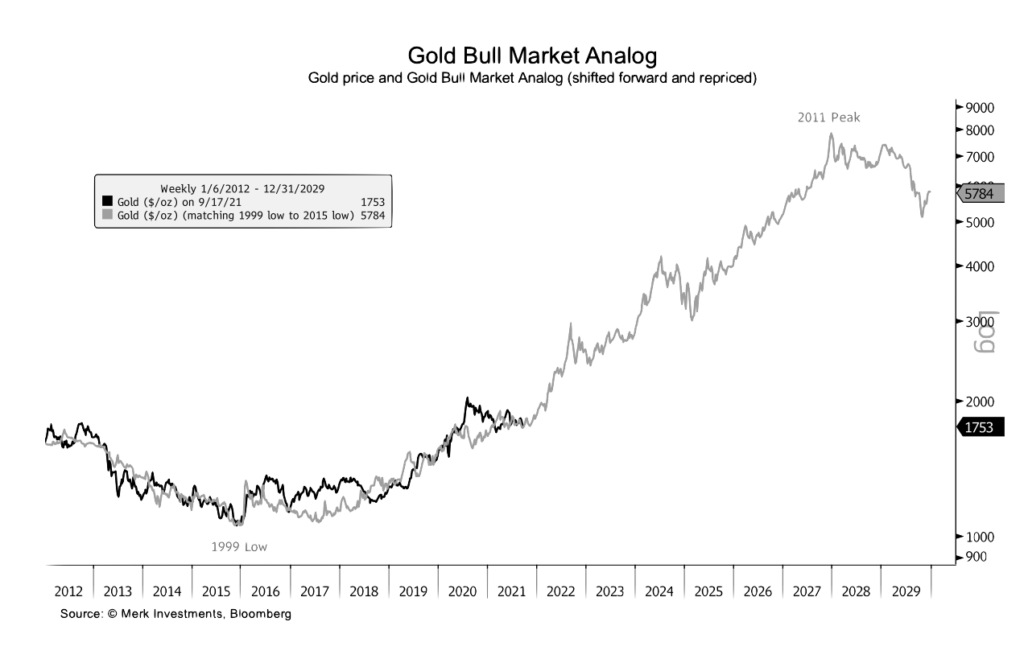
In support of Morris’ contention that “the next decade will belong to gold,” we offer four instructive charts from Merk Investments. The first two show the close correlation between real rates of return and the price of gold. In the past, the declining real rate of return was driven by the rate side of the equation. Now, rising inflation expectations have become the primary influence – a development likely to focus increased attention on the yellow metal. The third chart shows the relationship between long-term growth in the global money supply and rising gold prices. Central bank stimulus is now feeding into the global money supply – something it did not do during the Great Financial Crisis (2008). As a result, we might see an acceleration in both trend lines – money supply and gold. The fourth and final chart is by far the most intriguing. It matches up the cyclical lows posted in 1999 and 2015 and shows gold now closely tracking the trajectory of its twenty-year secular bull market begun in the early 2000s.
Charts courtesy of Merk Investments • • • Click to enlarge
Short and Sweet
‘I expect a true crash to take a decade of stock market gains.’
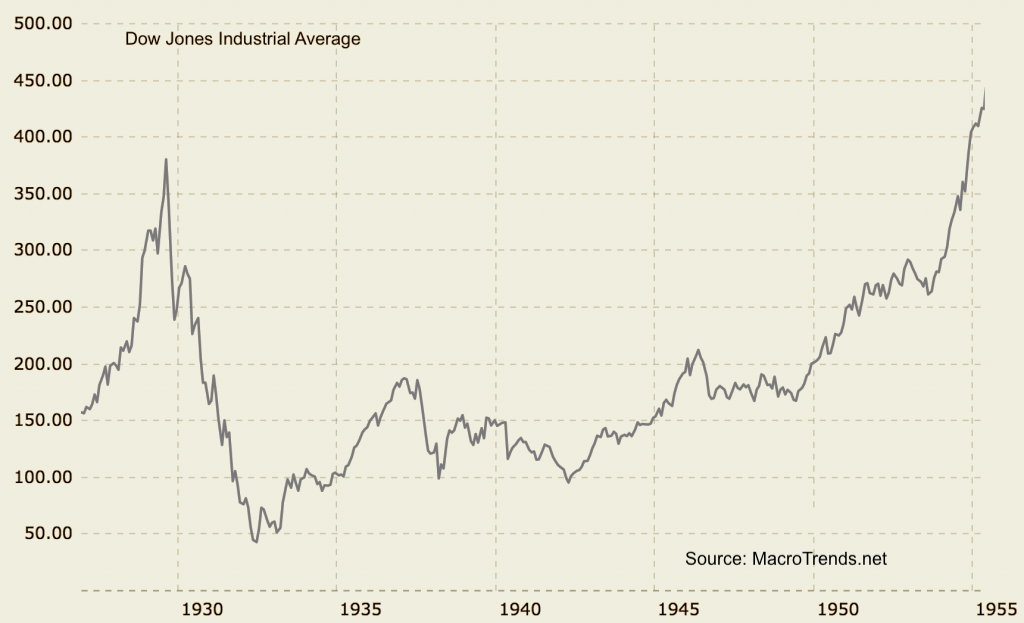
“‘If the pandemic doesn’t pop this bubble then, of course, it will be something else that eventually accomplishes this,’ says [Universa Investments’ Mark Spitznagel in a MarketWatch report], “reiterating his long-held belief that easy-money central banks and the bubble they continue to pump will eventually lead to a major global reversal. How bad could it get when it really goes sideways? ‘I expect a true crash to take back a decade [worth of stock-market gains],’ he told The Wall Street Journal last month.'” Spitznagel is a protege of Nicholas Taleb of The Black Swan fame. Some would consider his prediction going overboard. We should keep in mind, though, that from 1929 to 1933 the stock market lost almost 90% of its value. It did not return to its 1929 highs until 1955 – 26 years later. In short, what he is suggesting is not without historical precedent.
Chart courtesy of MacroTrends.net
Are you looking to solidify your hard-earned wealth for the long run?
DISCOVER THE USAGOLD DIFFERENCE
ORDER DESK: 1-800-869-5115 x100/[email protected]
ORDER GOLD & SILVER ONLINE 24-7
Short and Sweet
Beware the new mantra that stocks are a good inflation hedge
“So, to be clear, this April really was cruel,” writes John Authers in his regular Bloomberg column, “In terms of the basic economic numbers that affect us most, it was the cruelest month for the U.S. in many decades. It was only one month. It is way too soon to proclaim the beginning or end of a major economic trend, on the base of the data we have so far. But April’s data were not only very, very bad, but also very, very surprising. They need to be confronted and understood.” Authers is surprised at the markets’ muted reaction to “a bad unemployment number followed by a bad inflation number.” He warns that if inflation does take root, stocks have plenty of room to fall further.
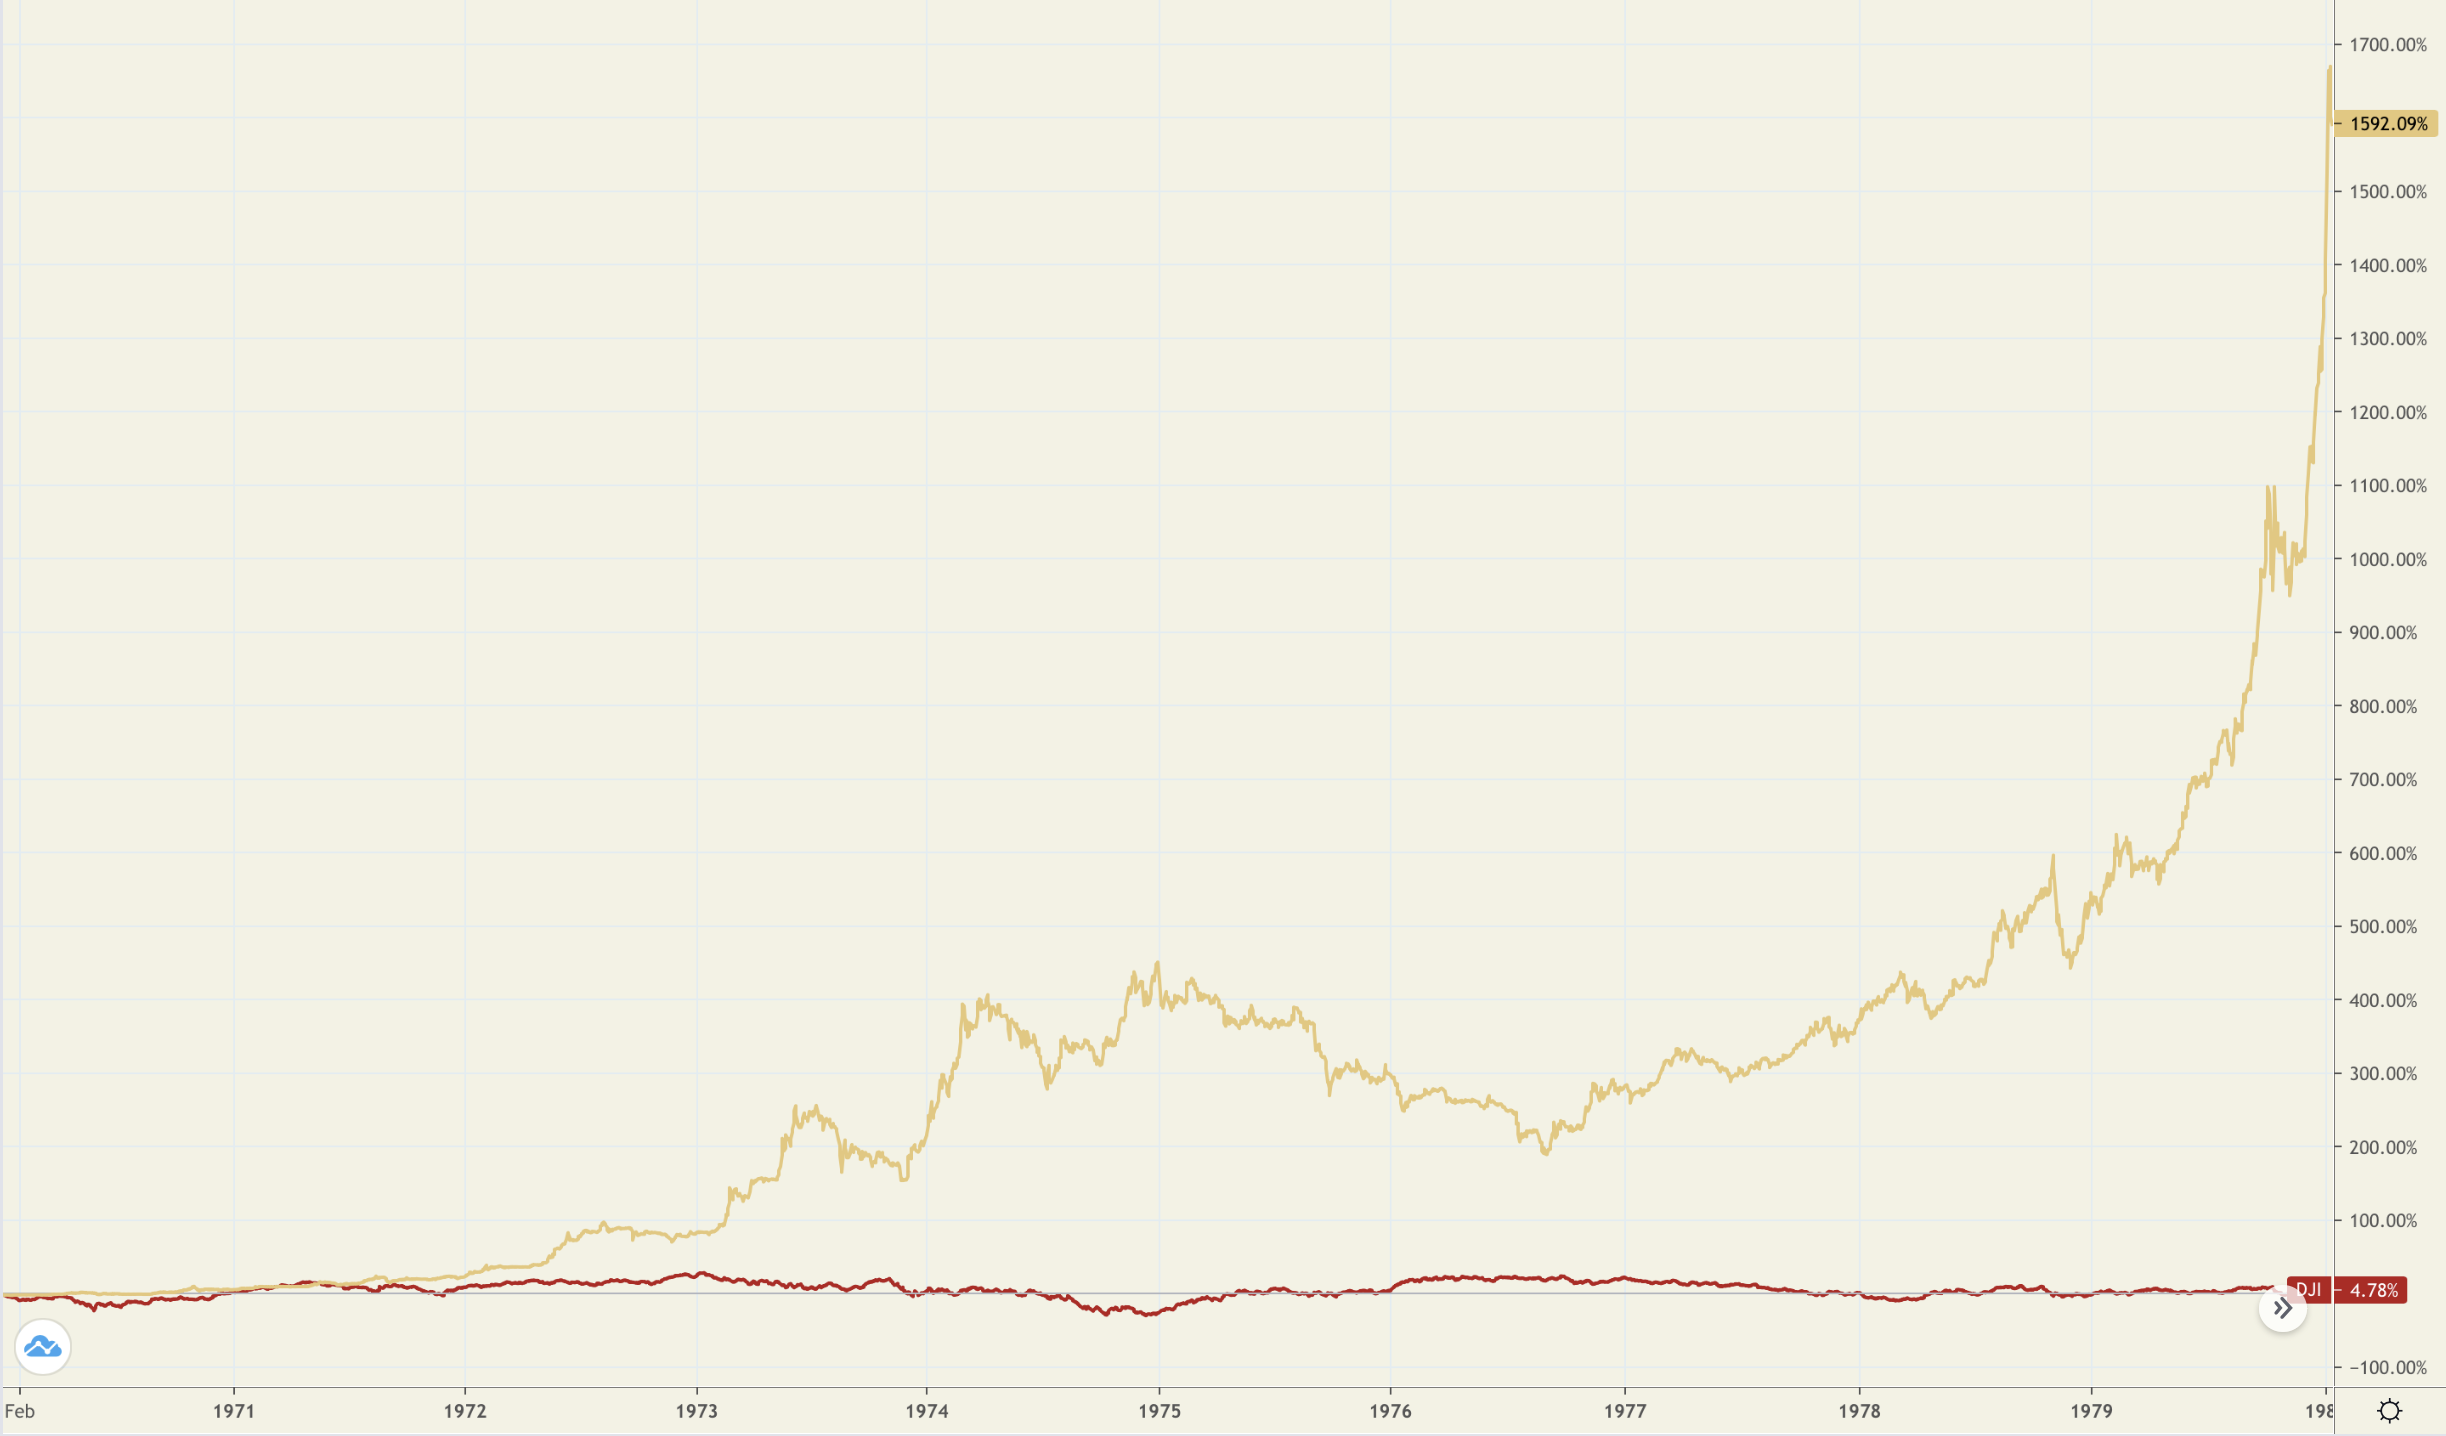
The chart below shows what happened in the 1970s once investors realized that inflation was not “transitory” but entrenched instead. Stocks drifted sideways for most of the decade, managing only a 4.78% gain. Gold, on the other hand, gained 1592%. We sometimes overlook the fact that stocks peaked in the late 1960s, just before the inflation began. Nearly twenty years of sideways to down action followed. Stocks started and ended the 1970s at 1000 while runaway inflation raged.
Gold and Stocks
(In percent, 1970-1979)
Chart courtesy of TradingView.com • • • Click to enlarge
Short and Sweet
––––––––––––––––––––––––––––––––––––––––––––––––
Is Buffett wrong about gold?
“While I very often agree with Warren Buffett’s views regarding, for example, the level of cash in portfolio or migration from growth to value stocks,” says Independent Trader for ETF Trends, “I absolutely can not agree with what he wrote in the letter to shareholders about gold, once again showing how badly it performs in comparison to the US shares.” The article goes on from there to do a good job of debunking Buffett’s latest attack on gold – one of many he has conducted over the years – while drawing on cyclical analysis to lay out a solid longer-term future for the metal. It concludes with the opinion that Buffett’s stance on gold is “part of a deal with the establishment of the United States.”
That could be true, but it could also be little more than an old professional bias on Buffett’s part going back decades combined with a classic talking of one’s book. We counter with a single chart that refutes his arguments at a glance. It tells the story of gold and stocks in the times in which we live – the historically distinct fiat money era that began in 1971 – not some other timeline that carries little relationship to the present. To make a very long story short, gold has appreciated 3,399% since January 1971. Stocks have appreciated 2,884%. What’s more stocks are bumping against all time highs while gold looks like it might be in the early stages of a new bull market run.

Repost from 2/20/2020
______________________________________________

Looking for more than an e-commerce platform?
DISCOVER THE USAGOLD DIFFERENCE
"Contemporary precious metals services.
Traditional appeal.
1-800-869-5115
Extension #100
8:00 am to 7:00 pm MT weekdays
Prefer e-mail to get started?
[email protected]
ORDER DESK
Great prices. Quick delivery. All the time.
Modern gold and silver bullion coins
Historic fractional gold coins (bullion-related)
Historic U.S. gold coins
________
CURRENT PRICES
8:30 am Sun. May 5, 2024
Live Prices • Order Anytime
|
American Eagle
Please call or e-mail the Order Desk if you have questions. |
|
Want to learn more about investing in gold and silver? This solid, in-depth introduction offers the basic who, what, when, where, why and how of precious metals ownership you've been looking for.
And when it comes time to make your first or next precious metals purchase, we invite you to discover why thousands of discerning investors have chosen USAGOLD as their precious metals firm.
|
Top Gold News & Opinion Join us for our live daily newsletter LATEST POSTS
_________________________
|
A contemporary web-based client letter with a distinctively old-school feel. |
website support: [email protected] / general mail: [email protected]
Site Map - Risk Disclosure - Privacy Policy - Shipping Policy - Terms of Use - Accessibility
1-800-869-5115


