
Gold pushes lower in continuation of yesterday’s sell-off
Saxo Bank says ‘watch closely what the FOMC does, not what it says.’
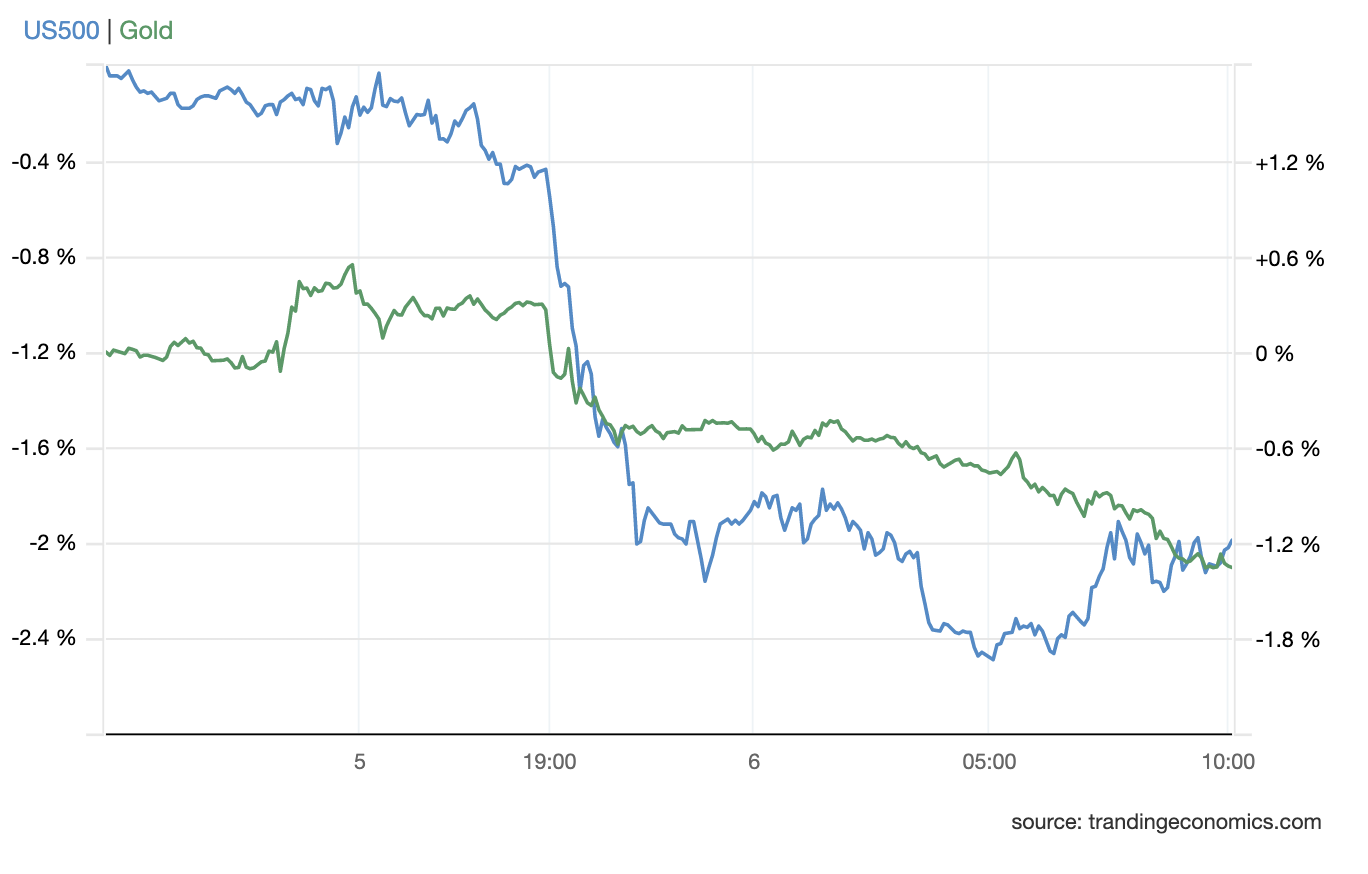
(USAGOLD – 1/6/2022) – Gold pushed lower this morning in a continuation of yesterday’s response to Fed meeting minutes indicating a more accelerated approach to policy tightening. It is down $16 at $1795. Silver is down 64¢ at $26.21. The meeting summary also recorded general agreement on an actual reduction of the Fed’s balance sheet after the central bank begins raising rates sometime in 2022, according to a CNBC report. The revelations instigated a minor taper tantrum in both stocks and bonds, and the gold market went into an immediate slide. (Please see charts below.) Saxo Bank’s head of commodity trading, Ole Hansen, offers some seasoned insights on how we should view policy pronouncements from the Federal Reserve, as well as early-year gold market action.
“The first couple of weeks in a new year often fails to deliver much in terms of directional inspiration and clues as to what happens next,” he says in a market update posted yesterday, “and until the picture becomes clearer with the regards to the direction of the dollar, the timing and pace of Fed rate hikes, gold may struggle for direction. Key to the ultimate direction hinges on the direction of the dollar and not least the how high real yields can go. We believe 2022 could offer a rough ride for global stocks as interest rates rise and consumers keep more money in their pockets following a wild year of strong consumer spending. We need to watch closely what the US FOMC does, and not what it says, as that will create the real impact. … We do not believe US real yields can rise to the extent that others are forecasting, and with that in mind and given prospect for US stocks coming off the boil, we believe that gold, as well as silver and platinum, will offer a positive return in 2022… A recovering gold price is likely to result in an even stronger performance in silver, and potentially also platinum.” [Emphasis added.]
Charts of the Day
Gold and S&P 500
(%, one day)
U.S. 10-Year Treasury Yield
(%, one day)
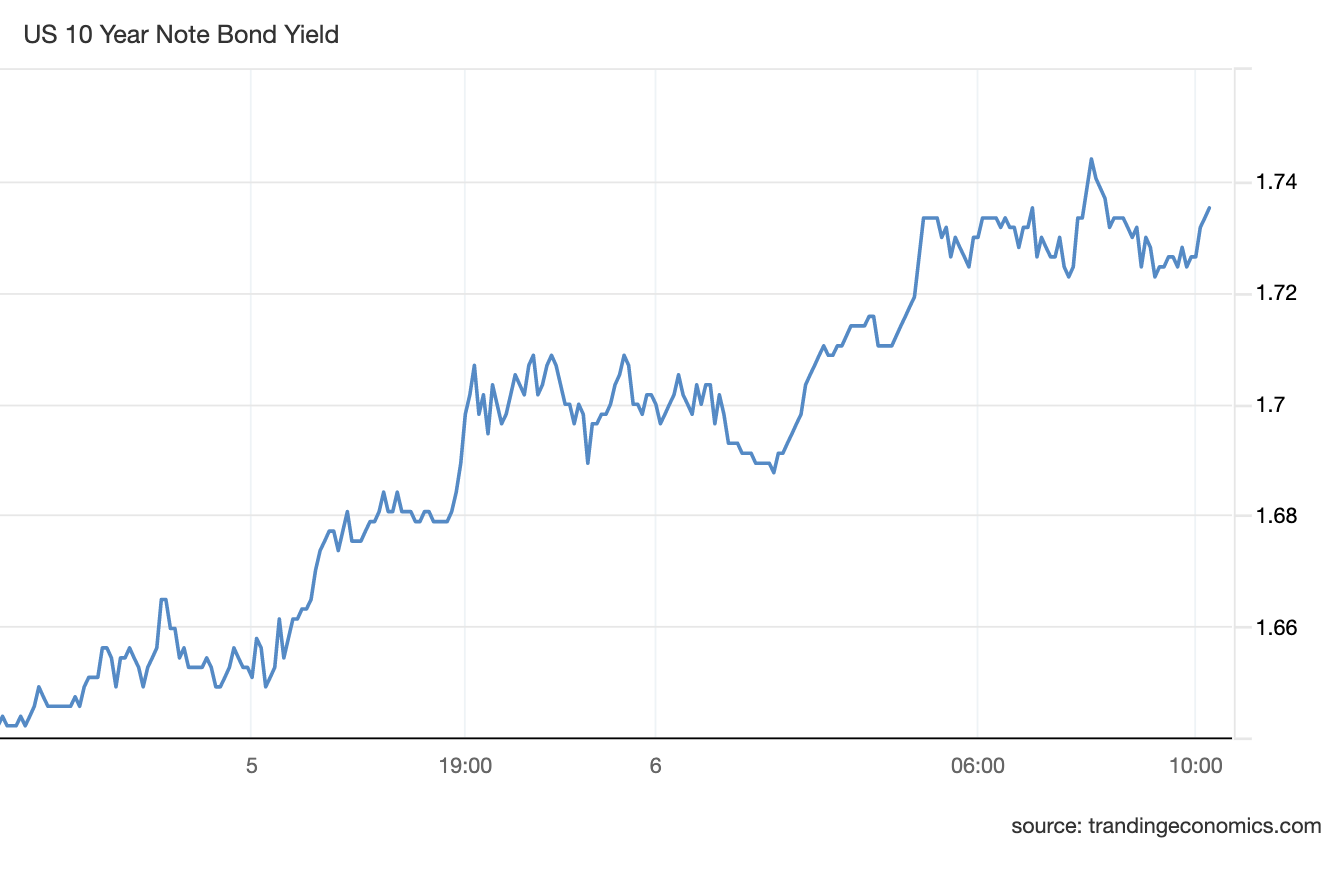
Charts courtesy of TradingEconomics.com
