
Gold tracks south as diverging central bank policies push the dollar higher
James Turk: ‘Gold preserves purchasing power over long periods of time.’
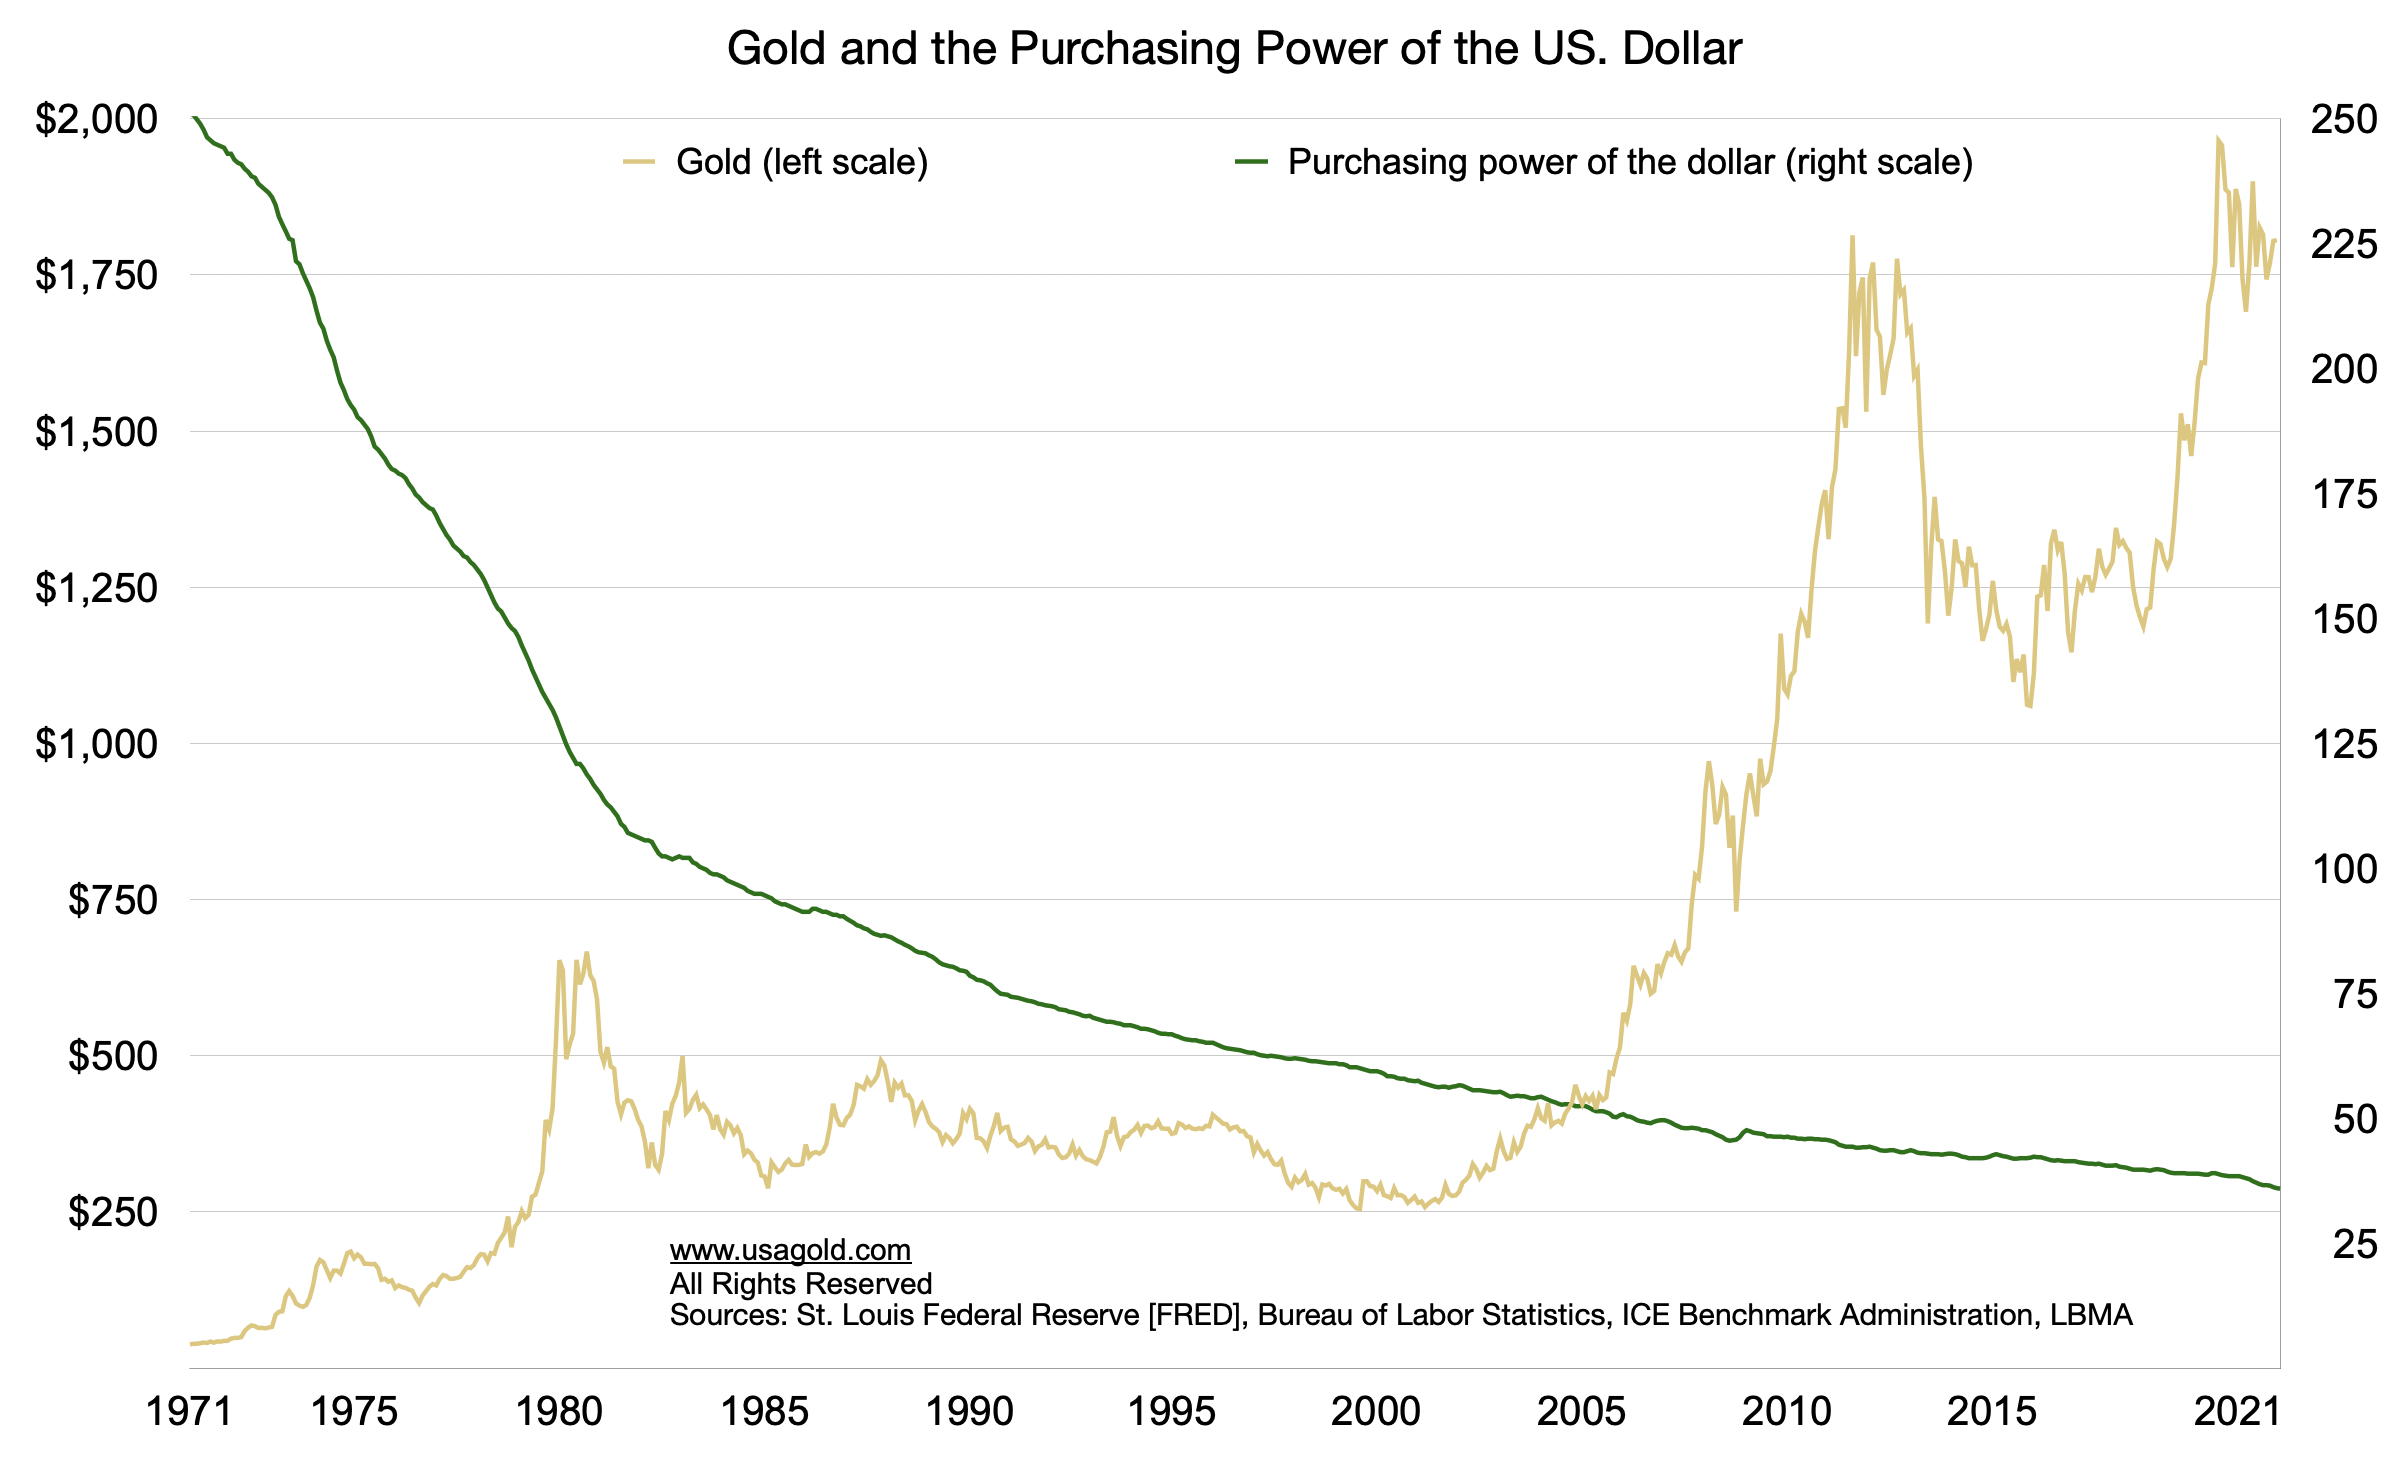
(USAGOLD – 4/22/2022) – Gold is tracking south this morning as a combination of hawkish Fed policy and dovish tilts in Japan and China pushes the dollar higher. It is down $15 at $1939. Silver is down 34¢ at $24.40. Though the dollar is in an uptrend against other currencies, its purchasing power in terms of goods and services is in sharp decline – and that, in the end, is what most concerns U.S.-based investors. Veteran market analyst James Turk made some insightful comments on that score in a recent interview posted at Epoch Times. Gold, he says, “does not suffer from entropy; it cannot be destroyed.”
“All the gold mined throughout history,” he continues, “still exists in its aboveground stock, which if formed in a cube could slide under the arches of the Eiffel Tower. Gold is mined and then accumulated because its greatest use is money. … Importantly, gold preserves purchasing power over long periods of time. Doing so enables sound economic calculation – namely, measuring prices – and that is essential to economic activity. For example, though the price of crude oil is rising in terms of euros, dollars, pounds, and the other national currencies, there is no inflation when prices are calculated in weights of gold. … A gram of gold buys essentially the same amount of crude oil as it did in 1950. This result occurs because the aboveground stock of gold grows by approximately the same rate as world population, causing the supply and demand for gold to remain in balance with the supply and demand of the goods and services humanity needs. Nature provides everything humanity needs to advance, including money.”
We offer two charts this morning to support Turk’s argument. The first shows the performance of gold against the long-term decline of the dollar. The second shows the sharp acceleration in that decline over the past eighteen months.
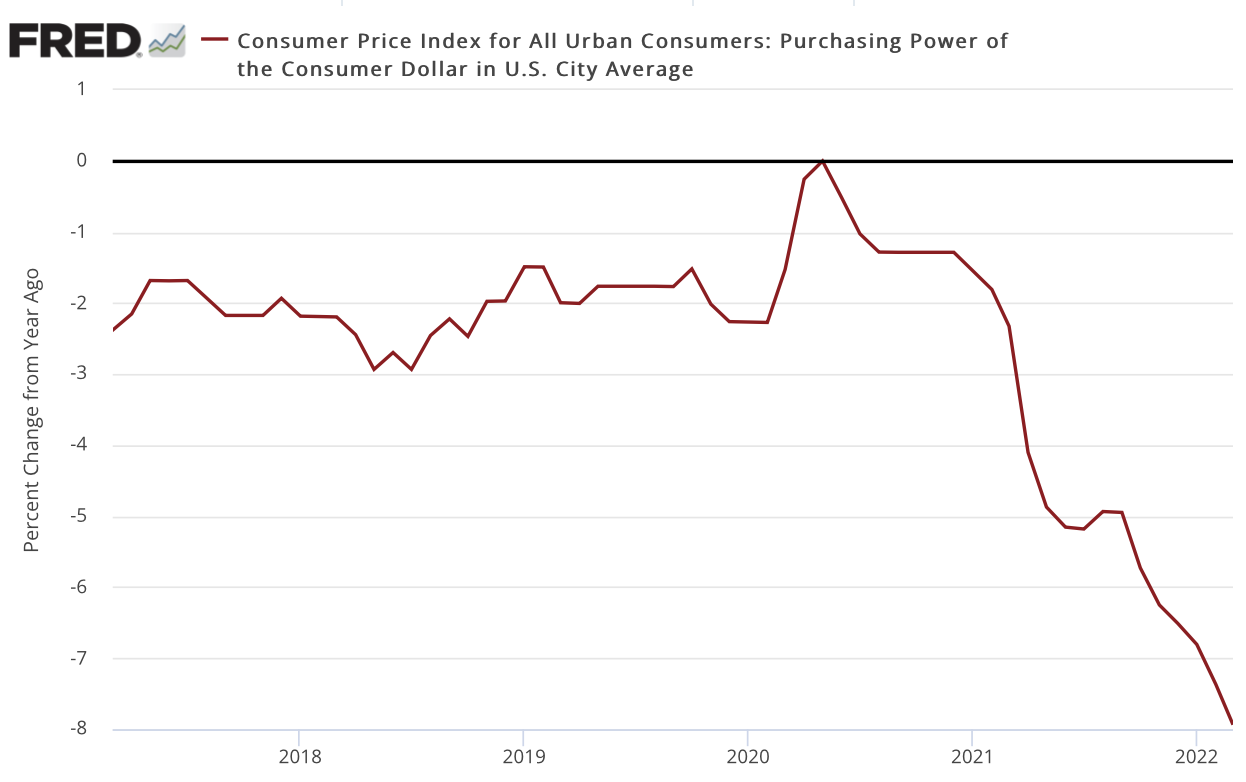
Sources: St. Louis Federal Reserve [FRED], U.S. Bureau of Labor Statistics
