Monthly Archives: May 2021
CPM Group: Silver price could reach $50 again
InvestingNewsNetwork/Georgia Williams
Repost from 5-21-2021
 “’We wouldn’t be surprised to see the price go back up and test US$30 or US$32 over the next several months,’ said Christian, who is a managing partner at the firm. He went on to note that market fundamentals have positioned the white metal to potentially surpass its previous US$50 highs, set in 1980 and 2011. However, before that can happen, the metal will hit a relatively modest growth pace in late 2021 or early 2022.”
USAGOLD note: Christian’s bullish views on silver came in conjunction with CPM Group’s release of its 2021 Silver Yearbook. He sees silver rising sharply in concert with the next financial or economic crisis. The next black swan, he says, may be closer than we think.

Inflation psychology is being jolted back to life
BloombergOpinion/John Authers/5-17-2021
 “In inflation, as in many other areas of economic life, perceptions can form reality, and that is certainly true of inflation. That is why the Federal Reserve wants to see expectations ‘well-anchored.'”
USAGOLD note: The Fed will make every attempt to control the narrative on inflation, but it cannot control what people think and how they react financially and economically to their perceptions – and that includes money managers as well as consumers. The price of gold was jolted back to life along about the time inflation psychology suffered the same fate.
The U.S. market’s CAPE is now the world’s highest and this gives stock investors little cover
MarketWatch/Mark Hulbert/5-8-2021
 “The CAPE [Cycically Adjusted Price Earnings ratio] currently stands at 36.6 for the S&P 500 SPX, -0.12%, according to Shiller’s latest calculations. That’s higher than 98% of monthly readings since 1881, and more than double the 140-year average, suggesting an extremely overvalued market.”
USAGOLD note: Hulbert goes on to say that that the comeback to the overvaluation charge (with which he disagrees) is that the world has changed. In a certain sense, that claim carries some validity. If stocks become assets that are being pushed higher simply based on monetary inflation rather than standard methods of valuation, then they can rise without any connection to earnings. That said, Hulbert says: “Dismiss CAPE at your peril.”
Gold firms as inflation trade gains traction, yields steady, dollar stumbles
Analyst says ‘we are nearing crucial inflection point’ for global gold investment demand
(USAGOLD – 5/3/2021) – Gold firmed during Asian trading hours as inflation-related buying gained traction, yields steadied, and the dollar stumbled. It is up $16 at $1786.50. Notably, silver is up 43¢ at $26.44 – indicative perhaps of ramped up inflation-based trading. The market is also displaying some signs of short-covering. Long-time market analyst Adam Hamilton picked up a shift in last week’s World Gold Council demand stats worth passing along.
“From 2015 to 2019,” he observes in a piece posted at Seeking Alpha, “[top demand] categories averaged accounting for 51% [jewelry], 29% [investment], 12% [central banks], and 8% [technology] of overall global gold demand each year. But 2020’s pandemic chaos shuffled these rankings, with lockdowns hammering jewelry demand while investment demand exploded. Those four categories represented 38%, 47%, 7%, and 8% of last year’s overall world gold demand…We are nearing that crucial inflection point,” he continues, “where gold investment demand reemerges in a young upleg before soon becoming self-sustaining. And there’s certainly good reason for diversifying portfolios with gold.” We might add that recent reports of strong post-lockdown demand from China and other parts of Asia, where the greatest proportion of jewelry demand originates, could have a compounding effect on already stretched supplies, particularly if ETF demand also reverses course.
Chart of the Day
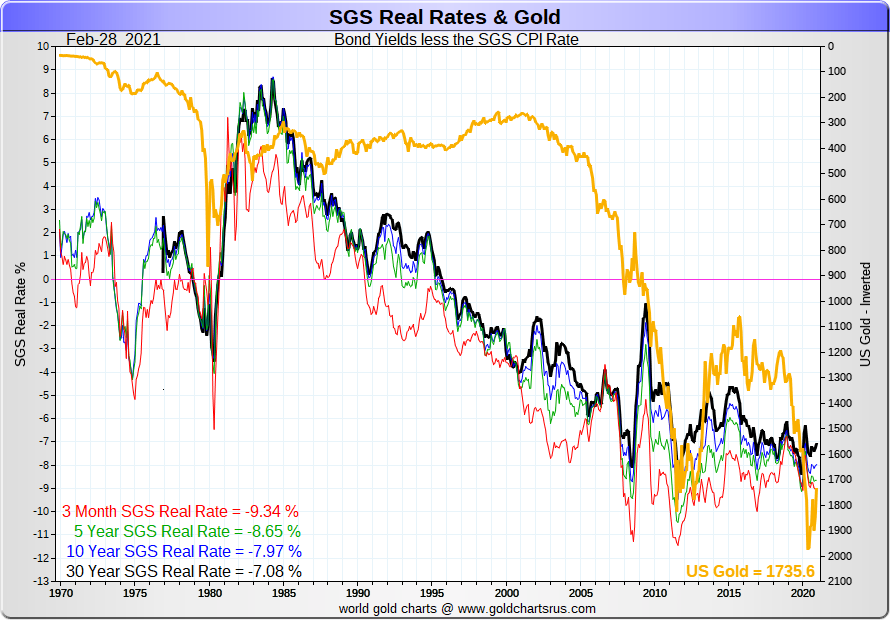
Chart courtesy of GoldChartsRUs • • • Click to enlarge
Chart note: This chart shows the negative real rate of return on various Treasury note and bond maturities applying Shadow Government Statistics’ rendition of the inflation rate – the same methodology utilized by the Bureau of Labor Statistics in the 1980s. A declining real rate of return has been the dominant trend since the mid-1980s, with negative real yields coming into play as early as the late 1990s. Keeping in mind that the current real rate of return based on current BLS inflation data is on the order of -0.67%, it is radically less than the -7.97% shown on the chart above. The price of gold (shown inverted) has responded accordingly, gaining momentum since the late 1990s.