

Crash update
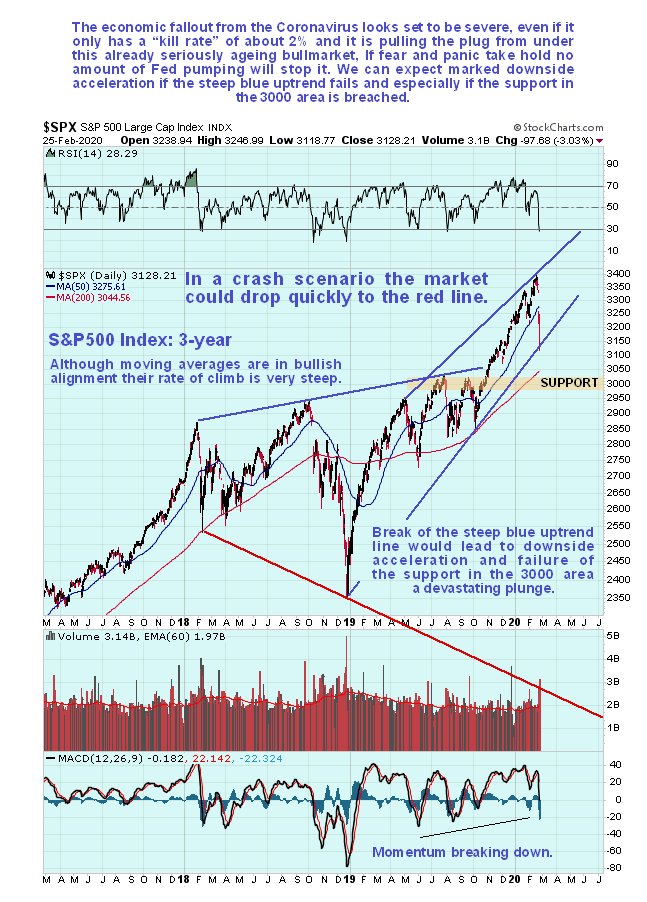
“To get an idea of how far the market could drop during this crash we must zoom out and look at longer-term charts. On the 3-year chart for the S&P500 index we see that late last year the market broke out upside from a bearish Broadening Formation and then ran up, but this breakout did not negate the bearish implications of the pattern – on the contrary, what often happens after such a breakout is that the market turns and crashes down through the pattern, which is what we are starting to see now. The index is already approaching its rising 200-day moving average and if it slices through that, and more seriously then drops through the support in the 3000 area, then we are likely to see even more downside acceleration with the market plunging vertically and cratering. Note, however, that we may first see a technical bounce from the support in the 3000 zone. Once the support in the 3000 zone fails, the index will target the red lower support trendline of the Broadening Formation, which if it gets there would obviously result in catastrophic losses.”
Repost from 3-1-2020
