
Short & Sweet
Gold and the Misery Index
Stagflation could force ‘a macro rotation into the precious sector’
Since the launch of the fiat money era in the early 1970s, when economies have gone very wrong, the unemployment and inflation rates have skyrocketed. On the campaign trail in the late 1970s, then-presidential candidate Ronald Reagan added the two numbers together and famously named the result the Misery Index. Subsequently, the Misery Index became the bellwether for stagflation – the combination of economic stagnation and runaway inflation.
With stagflation rising once again to the top of investor concerns, the Misery Index has made something of a comeback. Accordingly, we thought it would be a matter of interest to build a chart showing changes in the index plotted against changes in the price of gold. Though we had an inkling of the result, the uncanny long-term correlation between the two data sets took us by surprise. At a glance, the chart tells the story of gold as a runaway stagflation hedge. Gold also closely tracked the index more recently during the 2008 credit crisis and the 2020 pandemic-driven breakdown. Curiously, though, it has lagged the surge in the Misery Index over the past year and a half. This divergence probably has to do with Wall Street until recently largely buying into the Fed’s contention that inflation is transitory.
With the word “transitory” now officially banned from the Fed lexicon, the financial world is suddenly forced to consider the dual nature of stagflation and adjust investment portfolios accordingly. MKS Switzerland’s Nicki Shiels recently advised that a “stagflation would force a macro rotation out of typical reflation assets or commodities like oil and copper, and into the precious sector.”
“There’s going to be a realization in early 2022,” says Weiss Ratings’ Mike Larson in a report posted at Finbold, “that the Fed is not going to be able to be aggressive. People need to realize that this Fed is very tentative. It’s a Fed that has a lot of political pressure to favor the employment side of its mandate over inflation. … I don’t think it’s going to be a runaway where you’re talking about $4,000 gold, but you know, $2,200, $2,300 or $2,400, somewhere in that range, I think in sort of a corresponding moving silver, I think it is likely on the table. And again, it’s going to come from the release of that Fed fear, pressure valve, whatever that’s been keeping people from, getting involved.”
Misery Index and Gold
(% change, year over year, 1971- to present)
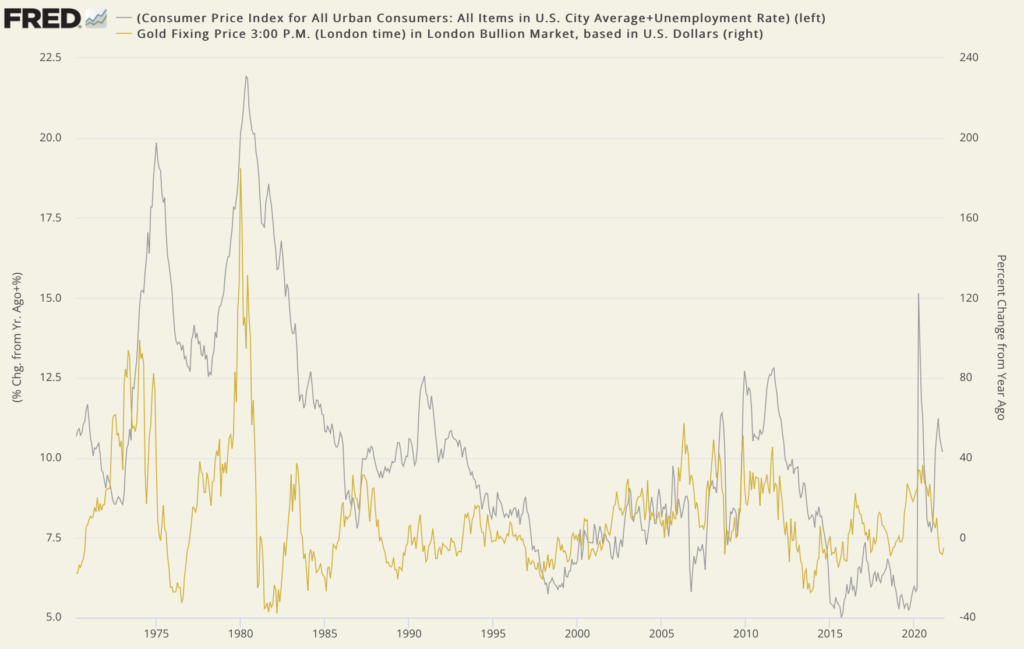
Sources: St. Louis Federal Reserve [FRED], Bureau of Labor Statistics, ICE Benchmark Administration
Click to enlarge
(For a real-time version of the Misery Index-Gold chart, please visit USAGOLD’s Gold Trends and Indicators.)
