
The National Debt and Gold
Here’s why the two have risen together since the 1970s
and why the correlation is likely to continue
by Michael J. Kosares
“The health of the country, the prosperity we care about, and the security we care about are just inextricably linked … and we keep looking away hoping it will get better, and it gets worse. It’s about the debt levels, and the inability to pay our own bills, and if we don’t get our fiscal house in order, it’s going to dramatically affect our security of our country.” – Admiral Mike Mullen, former chairman of the Joint Chiefs of Staff
Please note: This post features several interactive, live charts offered in conjunction with the St. Louis Federal Reserve and the ICE Benchmark Administration/LBMA. You can access statistical details by moving your cursor over the charts. If the chart does not automatically update, please move the toggle button on the year bar all the way to the right. We invite you to bookmark this edition for future reference.
CHART 1: Sustained by both political parties, the national debt has taken on a life of its own
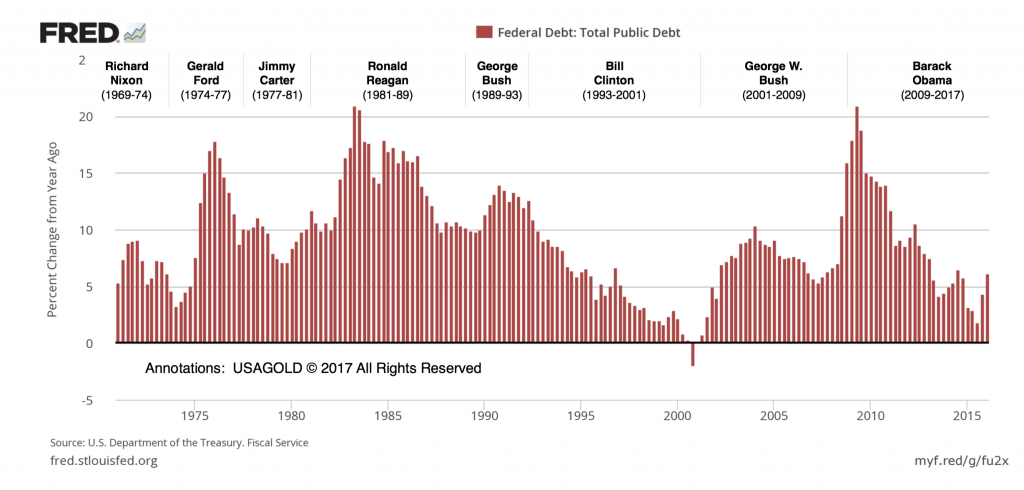
Since the early 1970s, the logic for gold ownership has been inextricably bound to the cash flow problems of the federal government. As the national debt increased so did the well-documented damage associated with it – to the dollar, to financial markets and to the economy in general. Simultaneously, gold’s role as an inversely correlated portfolio hedge grew over that nearly one-half century as well.
As you can see from the chart above, which shows the percent change in the national debt from the previous year, those problems do not favor any particular political party or president. In a certain sense, it has taken on a life of its own, marching to over $20 trillion without regard to party ideology. I mention that for the benefit of those who might think that somehow things might be different under a Trump administration. In fact, the greatest percentage growth in the national debt occurred surprisingly during Republican administrations.
“As GOP lawmakers are struggling to enact an agenda of spending and tax reform,” says one journalist, “they continue to face the painful reminder that Trump has no ideological drive to tame the deficit. The President has made clear that he doesn’t mind if deep tax cuts result in a ballooning of the national debt.”
CHART 2: How the national debt and the Fed could bankrupt the nation
DEFICITS MATTER!
Democrat Franklin Delano Roosevelt was the first to publicly declare that deficits did not matter since, he reasoned, we owe the money to ourselves. Dick Cheney, who should have known better, made the same claim on behalf of Republican deficits. Deficit denial has never held water simply because holders of government paper, foreign or domestic, intend to be repaid and with interest. It’s that part about creditors demanding interest that blows a hole in the “deficits-do-not-matter” argument. One of the stand-out features of the chart above is that, as interest rates have declined over the last several years, the interest paid by the federal government has increased markedly due to the rapid growth in the size of the accumulated debt.
Some quick background:
* * * In 2008 when the national debt stood at $10 trillion, the federal government paid $336 billion in interest. For a measuring stick, the ten-year Treasury bill drew an average interest rate at the time of around 3.66%.
* * * In 2012 when the debt crossed the $16 trillion threshold, the interest payment was almost $456 billion. The ten-year Treasury bill drew an average interest rate of 1.80%.
* * * In 2016 with the national debt approaching the $20 trillion mark, the interest payment was $497 billion. The ten-year Treasury bill drew an average interest rate of 1.84%. It is difficult to overlook the fact that 2016’s interest payment was an all-time record at the second lowest rate on the 46-year chart.
* * * At the current ten-year Treasury bill rate of 2.88%, the interest payment will exceed $750 billion, 20% more than what the United States spends annually on the national defense.
* * * If the average interest rate were to double from current levels to 4.5% as some analysts have projected, the United States would pay nearly $950 billion annually in interest on the national debt, or nearly one-third of 2018 tax revenues ($3.34 trillion). At that point, markets might begin to question the solvency of the U.S. federal government.
The exercise above points up the limitations on the Federal Reserve with respect to raising interest rates. It is a cautionary tale told in some very big numbers that promise to become even larger. In short, the onerous public debt has hamstrung the Fed in ways that policy-makers are loathe to discuss publicly. The Federal Reserve either keeps a leash on interest rates, or it bankrupts the nation. . . .
CHART 3: The national debt is the ultimate threat to the dollar’s reserve currency status
In the worst-case scenario, the accumulated debt and interest payments reach levels the markets find intolerable, threatening the dollar’s reserve currency status and foreign creditors’ confidence in U.S. Treasury paper. We came perilously close to that in 2011 when Standard & Poor’s downgraded America’s credit status citing the lack of “effectiveness, stability and predictability of American policymaking and political institutions.” Since then, an argument could be made that things have only gotten worse. Not only has the red ink flowed at an unprecedented rate, the U.S. debt to GDP ratio has gone from 62% in 2007 to 105% now. Among the G-20 nations, the United States now has the third worst debt-to-GDP ratio. Only Japan and Italy have worse. One cannot help but wonder what might lie ahead as we enter a new round of Washington wrangling over government finances.
CHART 4: The national debt has made gold a superstar
Few correlations in the financial markets ring truer and more consistently than the one between the federal debt and gold. That relationship between the two is about as fundamental as it gets because it goes to the heart of what’s wrong with the debt-based fiat money system. As the federal government borrows more and more dollars into existence and the banking system pushes those dollars through the global monetary system, it diminishes the value of all the other dollars already being held somewhere by somebody – domestic private investors, financial institutions, foreign governments and central banks, et al.
With respect to foreign holders of the U.S. sovereign debt, the process begins with trade imbalances that are later converted to Treasury paper in order to earn a yield. This process of replication simultaneously showcases gold, which cannot be replicated at will, as the dollar’s counterpoint and chief competitor – a superstar portfolio holding for reasons French president Charles DeGaulle famously outlined in his “Criterion” speech delivered in 1965. France set the tone and strategy for dealing with the “export” of dollars, as he described it, by converting those imbalances to gold and taking delivery within French borders.
From that time forward global investors, both private and public, have followed the French model with China’s current gold acquisition program the most notable recent example. The result is what you see on the chart. For those with capital preservation as the goal, gold has been a stalwart and productive ally since the United States went off the gold standard in 1971 and launched the era of fiat money, federal deficits and the massive federal debt.
As for the future, we should keep in mind that the very same conditions which created the long-term secular trend for both the national debt and gold are still in place today – nothing has changed fundamentally. As long as that is the case, we can assume gold will continue to attract capital as a long-term portfolio hedge just as it has, to varying degrees, through the first 46 years of the fiat money system. Please note, too, that gold is trading below the federal debt’s trend line, an indication that it might have some catching up to do in the months and years ahead.

A word on USAGOLD – USAGOLD ranks among the most reputable gold companies in the United States. Founded in the 1970s and still family-owned, it is one of the oldest and most respected names in the gold industry. USAGOLD has always attracted a certain type of investor – one looking for a high degree of reliability and market insight coupled with a professional client (rather than customer) approach to precious metals ownership. We are large enough to provide the advantages of scale, but not so large that we do not have time for you. (We invite your visit to the Better Business Bureau website to review our five-star, zero-complaint record. The report includes a large number of verified customer reviews.)
ORDER DESK
1-800-869-5115 Ext#100
[email protected]

Disclaimer – Opinions expressed on the USAGOLD.com website do not constitute an offer to buy or sell, or the solicitation of an offer to buy or sell any precious metals product, nor should they be viewed in any way as investment advice or advice to buy, sell or hold. USAGOLD, Inc. recommends the purchase of physical precious metals for asset preservation purposes, not speculation. Utilization of these opinions for speculative purposes is neither suggested nor advised. Commentary is strictly for educational purposes, and as such USAGOLD does not warrant or guarantee the accuracy, timeliness or completeness of the information found here.
Michael J. Kosares is the founder of USAGOLD and the author of The ABCs of Gold Investing – How to Protect and Build Your Wealth With Gold [Third Edition]. He is also editor and commentator for USAGOLD’s Live Daily Newsletter and editor of the News & Views monthly newsletter.
