
Monthly Archives: September 2021

No DMR today (9-21-2021). The following is yesterday’s report.
Gold marginally higher as Fed Week begins
MarketWatch’s Hulbert believes debt ceiling wrangle could push gold higher, stocks lower
(USAGOLD – 9/20/2021) – Gold is marginally higher in early trading as Fed Week begins – up $5 at $1761. Silver is down 3¢ at $22.43. With inflation registering as more virulent than forecasted, the economy still mired in uncertainty, and a battle looming in Congress over the debt ceiling, it appears the Fed governors will have considerably more to consider this week than is typically the case. Too, global stock markets took a tumble overnight in what looks like a contagion effect resulting from a possible debt default by Evergrande, the giant Chinese property developer. Some Asian markets were closed, but significant shockwaves registered in Hong Kong, several European markets, and the United States (where the Dow is down almost 650 as this report is posted).
We have not devoted much time and space to the looming Congressional battle over the debt ceiling simply because Washington usually comes to terms on the issue before any serious damage is done. Some, though, believe that it will be different this time around due to seemingly irreconcilable differences between Democrats and Republicans. MarketWatch’s Mark Hulbert thinks gold could rally in the face of the upcoming wrangle. “Don’t be surprised,” he adds in a column published recently at the MarketWatch website, “if stocks and Treasury yields fall.” He goes on to say that “the deadline over the debt ceiling and a possible government shutdown have not made it onto most investors’ radar screens.” Once it does, he says, “stocks, gold and bonds are likely to respond accordingly.”
Chart of the Day
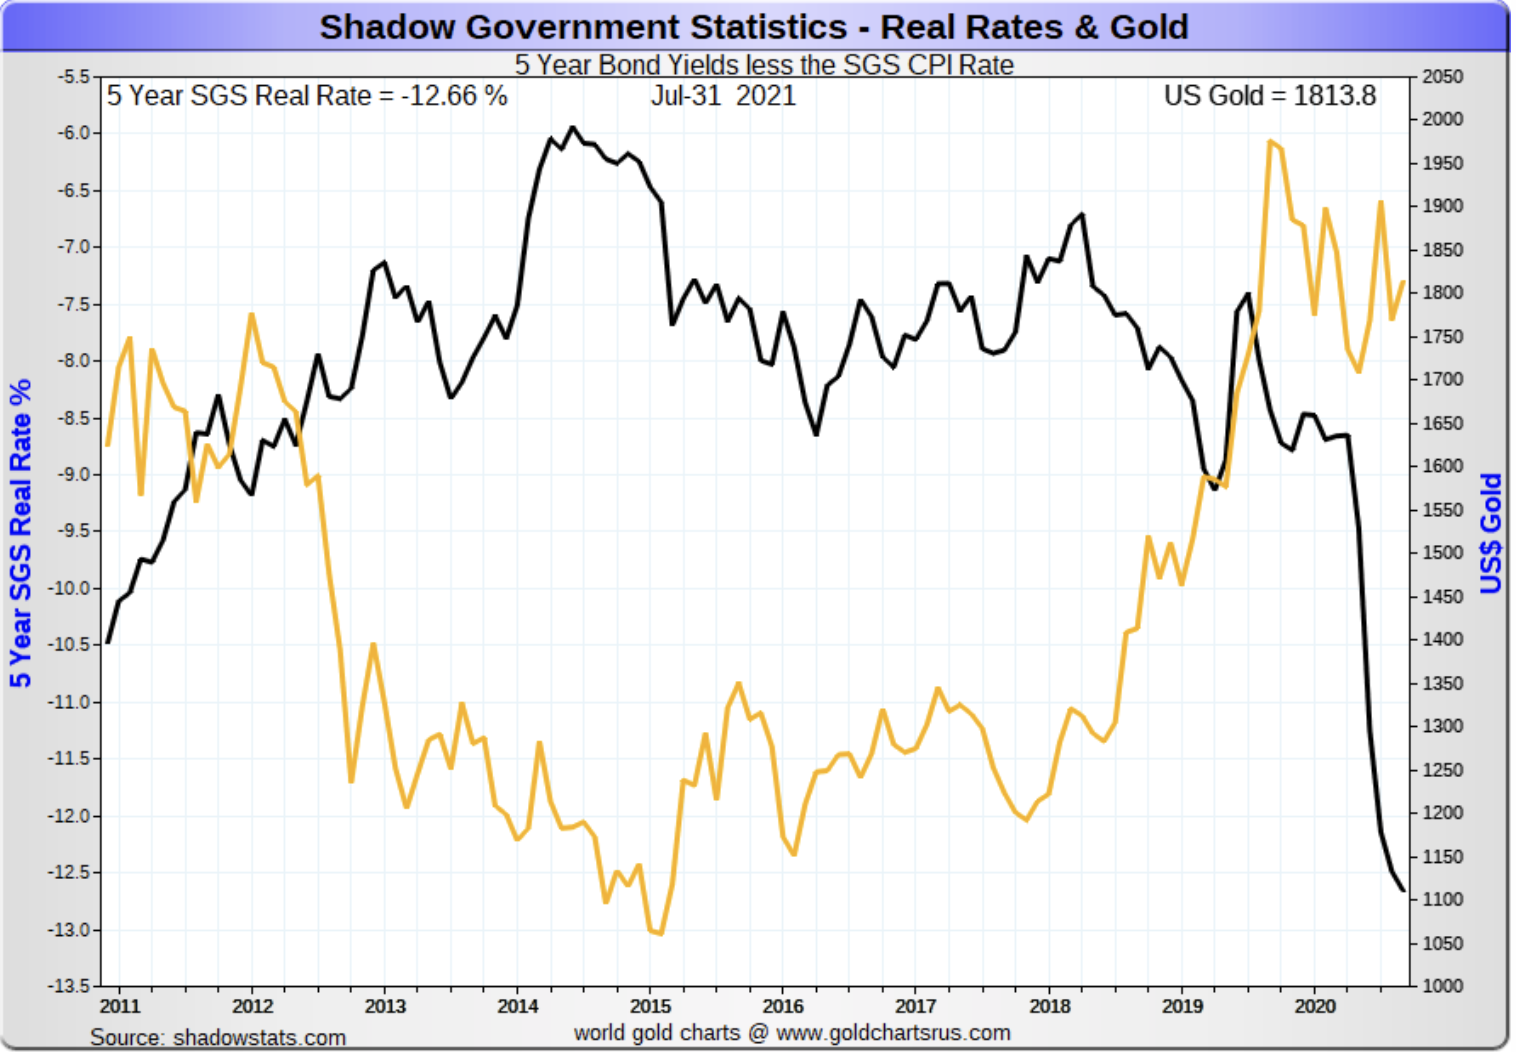
Chart courtesy of GoldChartsRUs.com
Chart note: This chart shows the negative real rate of return on the five-year Treasury note applying Shadow Government Statistics’ rendition of the inflation rate – the same methodology utilized by the Bureau of Labor Statistics in the 1980s. Keeping in mind that the current real rate of return based on current BLS inflation data is on the order of -0.67%, it is radically less than the -12.7% shown on the chart above. The price of gold has responded accordingly, gaining momentum since late 2017 when the real rate began to turn radically to the downside mostly the result of declining interest rates. Now a rising inflation rate has begun to play a role in the negative real rate of return. Gold, as you can see, has yet to register a commensurate advance.
Gold turns sharply to the downside
Will central banks put a floor under the gold price?
(USAGOLD – 9/16/2021) – Gold turned sharply to the downside in early trading as financial markets slipped into preparation mode ahead of next week’s Fed meeting. Expectations are mixed on the central bank’s direction, with some predicting it will advance the tapering agenda and others believing it is likely to continue treading lightly. This morning, at least, it seems the tapering view has the upper hand. The yellow metal is down $23.50 on the day at $1771. Silver is down 52¢ at $23.37. Expert opinion varies on which sector of the gold market will provide the strongest impetus in the years to come – Asian demand, the market for an inflation hedge, institutional investor interest, reduced mine production, etc. We found the following observations from CME Open Market’s Andrew Capon of more than passing interest on that score.
“Perhaps the biggest support of all for gold,” he said, “is likely to come from central banks. At the turn of the century, the U.S. dollar made up 73% of reserves in the IMF’s COFER database. That has fallen to less than 60%. The share of Chinese renminbi and the euro have grown modestly, but the strong capital preservation characteristics of gold enable reserve managers to sell their dollars while waiting to see if a true competitor to the U.S. dollar will emerge from the challenging pack. … This long-term support for gold prices from central bank buyers could provide a floor above $1700, given that new supply is highly constrained. If inflation remains stuck above policy targets, asset allocators will be forced to reconsider the traditional role of gold as a hedge. That would help gold regain its luster and could move prices higher.”
Chart of the Day
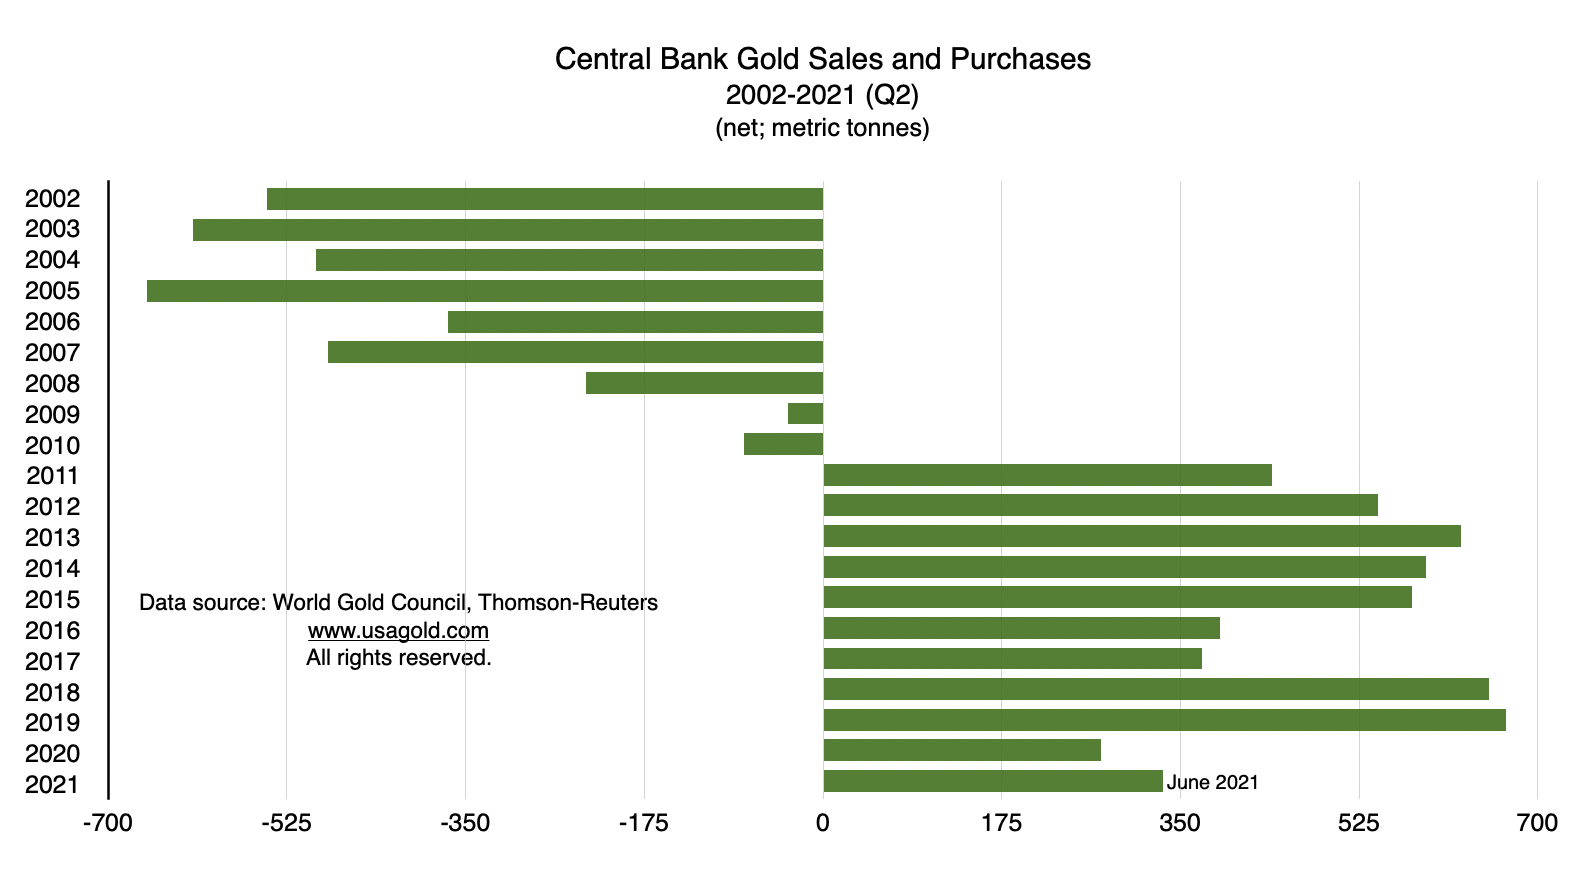
Chart note: The Reserve Bank of India purchased a record 29 tonnes of gold in June and almost 150 tonnes over the past year. The Central Bank of Brazil purchased 62.3 tonnes between May and July. The World Gold Council reports central banks as a group buying 333 metric tonnes of gold in the first half of the year. “Central banks,” it says, “are likely to continue buying gold on a net basis in 2021 at a similar or higher rate than in 2020, driven by a continued focus on diversification and risk management.”
Short and Sweet
Silver could be setting up for a repeat of 2020’s explosive rally
Silver’s performance over the past month offers a reminder of the metal’s volatility. Commodity analyst Andrew Hecht, whose experience in the silver market stretches back to the 1970s as a trader with Salomon Brothers, is well aware of the metal’s long history of radical ups and downs. “Silver volatility,” he writes in a recent Seeking Alpha article, “can be explosive. Meanwhile, the price action can also be coma-like, lulling market participants into a false sense of security for long periods. Silver’s history is full of false technical breakouts and breakdowns…Silver is a unique metal as it is part industrial, part investment asset. It experiences long periods of coma-like price action. Still, when it moves, as the price did not 2020, few commodities compare to the precious metal when it comes to percentage moves.” Hecht reminds readers of silver’s performance in 2020 when “bearish price action gave way to an explosive rally.” (Silver went from the $12 level in March to $29 by early August.) He goes on to say that “[t]he recent price dynamics could be setting up for a repeat performance given the rising level of inflation across all markets.”
Silver Volatility Index
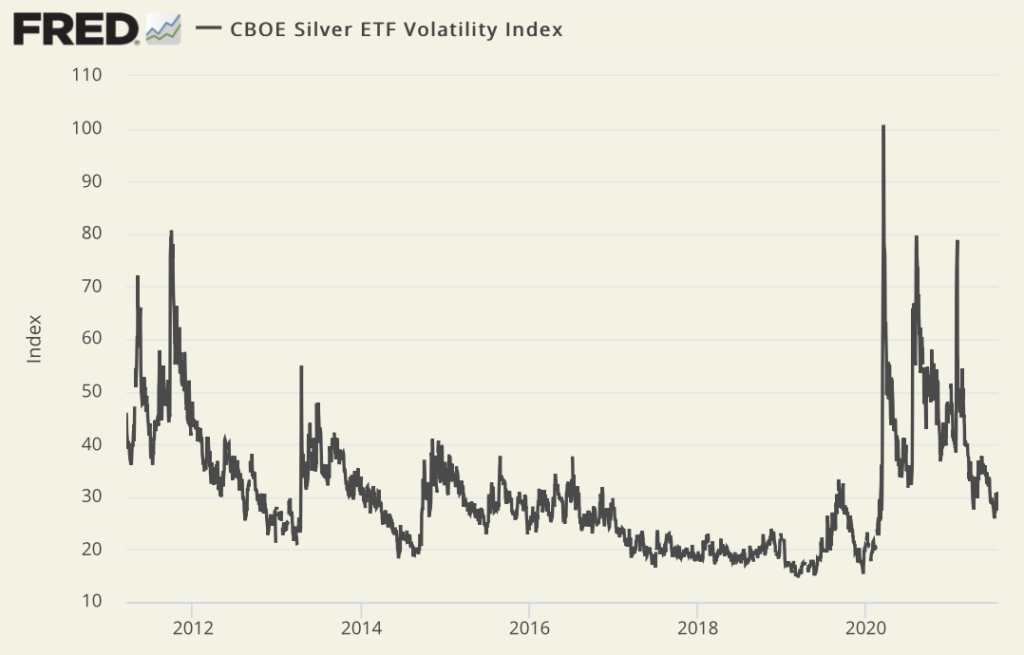
Sources: St. Louis Federal Reserve [FRED], Chicago Board Options Exchange
––––––––––––––––––––––––––––––––––––––––––––––––––––––––––––––––––––––––––––––––––––––––––––––––––
Looking to add a little white metal to your portfolio?
DISCOVER THE USAGOLD DIFFERENCE
ORDER DESK: 1-800-869-5115 x100/[email protected]
ORDER GOLD & SILVER ONLINE 24-7
Gold level in featureless early trading
Paulson tells why he believes gold is a good investment now
(USAGOLD – 9/10/2021) – Gold is level at $1795 in featureless early trading as it continues to seesaw in a range around the $1800 mark. Silver is up 3¢ at $24.12. In a recent Bloomberg interview, David Rubenstein asked John Paulson, the highly regarded Wall Street fund manager, if he believed gold was a good investment now. Paulson began his answer by reflecting on why inflation did not occur when quantitative easing was first introduced after the 2008 financial crisis. “The Fed bought Treasuries, created money,” he said, “which wound up in the banks and then was redeposited at the Fed. And the money never really entered the money supply. So it wasn’t inflationary. However, this time it has entered the money supply. … So I think we have inflation coming well in excess of what the current expectations are.” Our Chart of the Day offers eye-opening documentation of the money supply growth Paulson references.
Chart of the Day
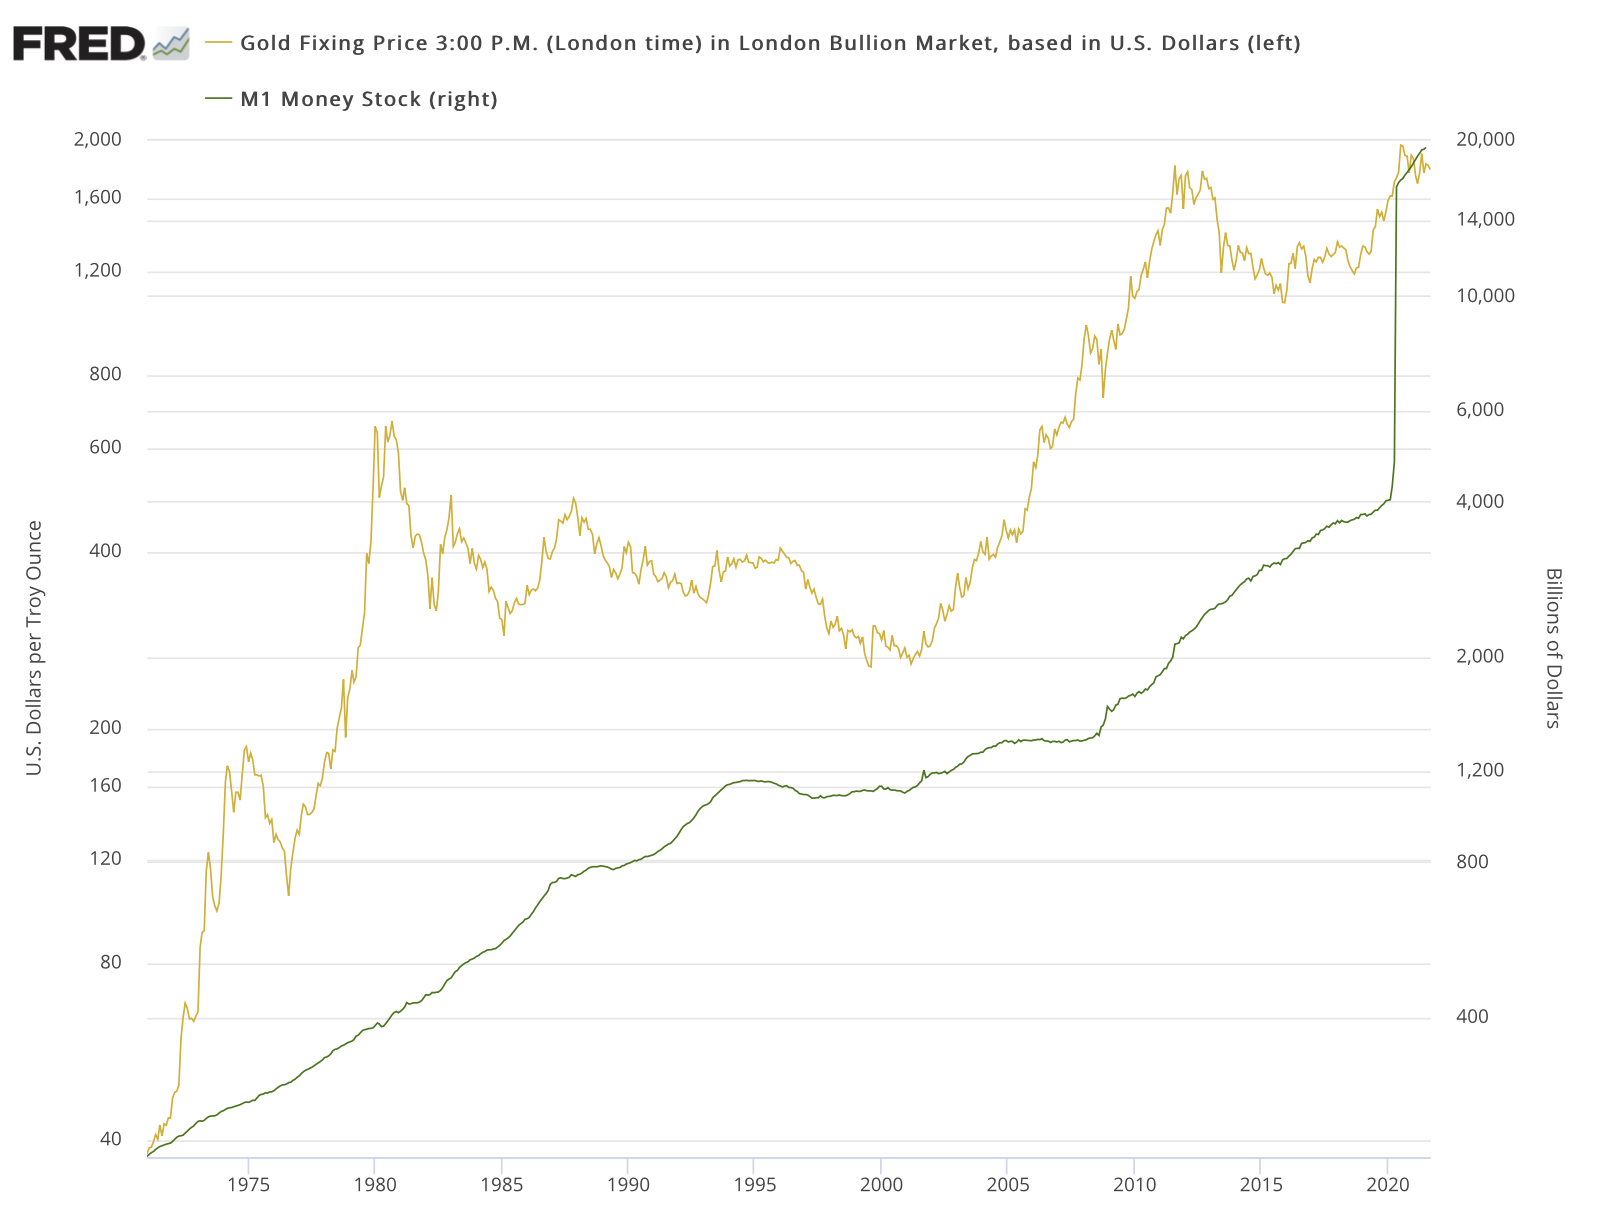
Sources: St. Louis Federal Reserve, Federal Reserve Board of Governors, ICE Benchmark Administration
Click to enlarge
Chart note: With inflationary concerns moving to the forefront, a handful of analysts have made strained attempts to show that gold is not truly an inflation hedge – an endeavor that generally requires the manipulation of timelines and statistics to make the point. The chart above is drawn to log scale and, as a result, provides a truer representation of monetary growth and its relationship to the gold price. As you can see, monetary growth spiked in 2021 – an event to which gold has not yet reacted.
Notable Quotable
–––––––––––––––––––––––––––––––––––––––––––––––––––––––––––––––––––––––––––––––
“Markets tend to veer between two extremes: fear and greed. But right now, the dominant emotion appears to be confusion. . . As one top hedge fund manager says: ‘No one has a view, and everyone is positioned accordingly.’”
Robin Wigglesworth
Financial Times
–––––––––––––––––––––––––––––––––––––––––––––––––––––––––––––––––––––––––––––––